NET-WORKS 1.0
James A. Kitts
Dept. of Sociology
Cornell University
323 Uris Hall
Ithaca, NY 14853
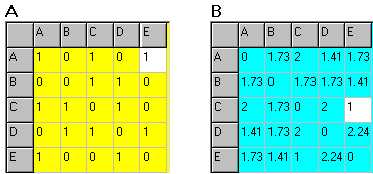
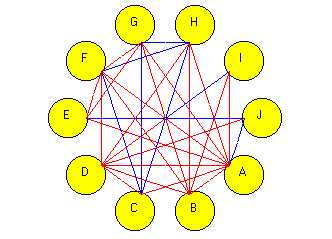
The interface also allows the user to visualize the matrices
as directed graphs.
Ties between nodes appear as line segments, while the color and
brightness of lines indicate the value and strength of ties:
The application implements a variety of network-analytic routines, including assessments of structural similarity (CONCOR, principal components analysis, multidimensional scaling, cluster analysis), node centrality (indegree, outdegree, closeness, prominence, relative centrality, multiplexity), and global network properties (density, cohesion, mean nodal degree, diameter, transitivity, connectedness).
These various analyses appear in a simple Windows 95/98 user interface. For example, the following dialog box will allow user input for a cluster analysis:
Most analyses give a detailed text output. For example, the following output reports a principal components analysis of a 5-node adjacency matrix:
Principal Components Analysis
PC
Eigenvalue % of Variance
1
2.3700 47.3%
2
1.2000 24.1%
3
0.5740 11.5%
4
0.4840 9.7%
5
0.3720 7.4%
Converged
in 46 iterations
Col
PCI PC2
A
0.4430 -0.4390
B
0.4560 -.2960
C
0.4800 -.3060
D
0.4410 0.5330
E
0.4120 0.5850
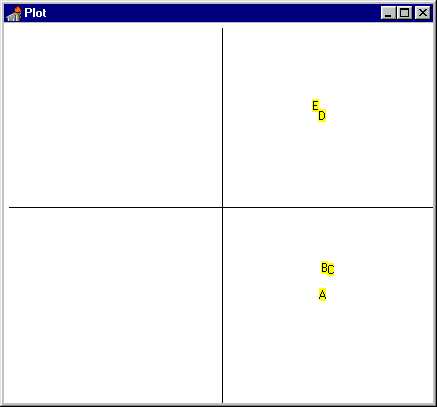
Many routines also allow visualization of results, such as the following loading plot of the above two-factor solution:
The program also performs basic matrix operations and transformations (matrix arithmetic, transpose, symmetrize, binarize, exponentiate, normalize, row/column centering, correlation, Euclidean distances, path distances) and statistical routines, all available through pull-down menus or toolbars.